
期货文华软件K线图上随着最新价格跳动的黄虚线怎么调出来
admin未知
期货文华软件K线图上随着最新价格跳动的黄虚线怎么调出来
期货文华软件K线图上随着最新价格跳动的黄虚线怎么调出来
期货文华软件K线图上随着最新价格跳动的黄虚线怎么调出来
不少期货投资者,在使用文华的时候,喜欢看最新的价格波动,文华K线图上,可以设置一根长虚线,跟随着最新价波动,价格跳动,K线图上的长虚线也实时跟着跳动,这样就可以清晰的看到,价格到那个支撑位置了,到那个压力位置了,便于技术分析,如下图所示:

如上图所示:盘中长虚线跟着价格实时跳动,在K线图上,可以很清晰的显示涨跌到哪个支撑和压力位置
有很多投资者不知道怎么设置这个黄虚线,有的投资者认为这个属于自己编写的指标,实际上,并不是,新版的文华,已经自带了此功能的调出功能:
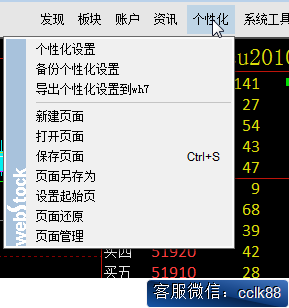
第一步,打开文华右上角“个性化设置”,点击“个性化设置”
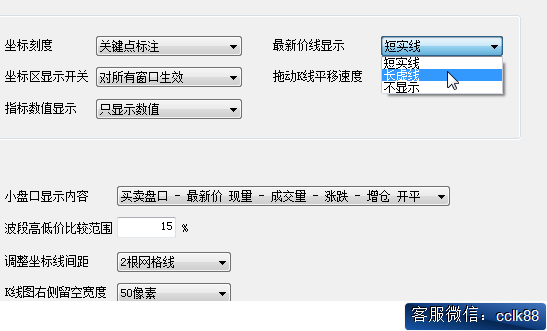
第二步:打开个性化设置后,选择“更多K线图设置2”
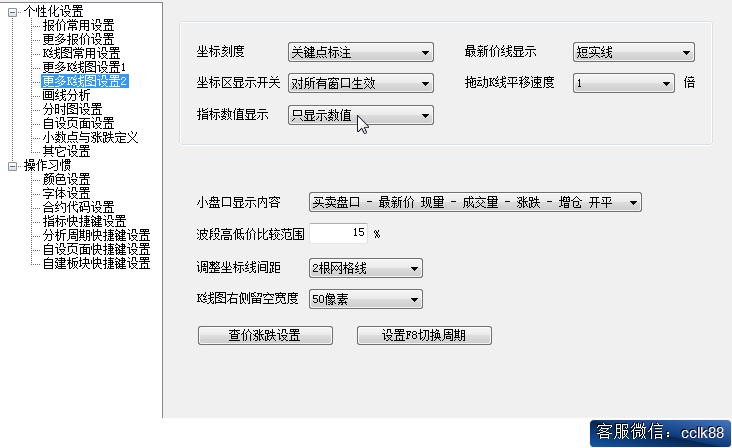
第三步:在更多K线图设置2里面。找到“最新价线显示”,选择“长虚线”,点击确定就可以实现此项功能了


微信扫码二维码 “零佣金”期货开户